WORKFORCE PLAN
2023-2026
Updated 2024
Publication date: 26/08/24
Workforce Plan 2023-2026
Page | 0
link to page 4 link to page 5 link to page 6 link to page 6 link to page 6 link to page 6 link to page 7 link to page 7 link to page 8 link to page 9 link to page 11 link to page 11 link to page 12 link to page 12 link to page 12 link to page 14 link to page 15 link to page 16 link to page 16 link to page 18 link to page 18 link to page 19 link to page 20 link to page 21 link to page 21 link to page 22 link to page 22 link to page 23 link to page 23 link to page 23 link to page 24 link to page 24 link to page 24 link to page 25 link to page 25 link to page 25 link to page 26
Contents
CEO’S Message .......................................................................................................... 3
Introduction .............................................................................................................. 4
About the City ............................................................................................................ 5
Vision ...................................................................................................................... 5
Purpose ................................................................................................................... 5
Values ..................................................................................................................... 5
Our Plan for the Future ............................................................................................... 6
Outcomes ................................................................................................................. 6
Structure ................................................................................................................. 7
Services ................................................................................................................... 8
Workforce Planning ................................................................................................. 10
What is workforce planning? .......................................................................................10
The City’s Process for Development of the WFP .............................................................11
Review of the Environment ...................................................................................... 11
External Environment ................................................................................................11
Technology ......................................................................................................... 13
Employee Skills – Employment Growth and Skills Shortages ....................................... 14
Flexible Working Arrangements .............................................................................. 15
The Great Resignation ........................................................................................... 15
Internal Environment ................................................................................................17
FTE & Headcount 2023 .......................................................................................... 17
FTE & Headcount 2024 .......................................................................................... 18
Gender ............................................................................................................... 19
Age
............................................................................................................... 20
Length of Service ................................................................................................. 20
Vacant Positions ................................................................................................... 21
Turnover............................................................................................................. 21
Employee Costs ................................................................................................... 22
Training/Development Costs .................................................................................. 22
Data Review and Analysis ........................................................................................ 22
Key Focus Areas ...................................................................................................... 23
Talent Acquisition .....................................................................................................23
Talent Development ..................................................................................................23
Employee Retention ..................................................................................................24
Technology ..............................................................................................................24
Service & Program Review .........................................................................................24
Organisation Culture .................................................................................................25
Workforce Plan 2023-2026
Page | 1
link to page 27 link to page 34 link to page 35 link to page 37
Initiatives ................................................................................................................ 26
Reviewing the WFP .................................................................................................. 33
FTE Forecasts .......................................................................................................... 34
Appendix 1 - Sources ............................................................................................... 36
Workforce Plan 2023-2026
Page | 2
 CEO’S Message
The Executive Leadership Team (ELT) is committed to creating an environment that
strengthens our ability to achieve the outcomes of the
Strategic Community Plan 2020-2040
(SCP) and
Corporate Business Plan 2022-2026 (CBP). Through the implementation of this
Workforce Plan 2023-2026 (WFP), we are shaping the direction of how the City will build
workforce and organisational capacity and capability during the life of the WFP.
The process of putting the WFP together has considered the following key questions:
• What are our long-term organisational goals we want our workforce to deliver?
• What does our current workforce look like?
• What should our future workforce look like to achieve these goals?
• What skills and capabilities will be needed and how is it different to that which we have
now?
• What are the gaps?
• What trends can we see that might impact the workforce in the future?
• Do we know enough about what is predicted or is it still emerging or changing too quickly
to predict?
• What are the barriers to achieving a workforce that has the capacity and capability to
deliver on our long-term organisational goals?
• How do we identify and plan for these changes?
As a result, the WFP outlines a range of Initiatives designed to address six Key Focus Areas
(KFAs):
1. Talent Acquisition
2. Talent Development
3. Employee Retention
4. Technology
5. Services & Program Review
6. Organisation Culture
The WFP is an organisational plan that is owned by the directors and I (ELT) and the
management team (OLT). It is our responsibility to ensure the development and
implementation of the Initiatives that will address the KFAs. However, I would like to
acknowledge the work undertaken by the People & Culture team in facilitating the
development of the WFP.
On behalf of the ELT, I endorse the KFAs and associated Initiatives outlined within the WFP.
John Christie
CHIEF EXECUTIVE OFFICER
29 June 2023
Workforce Plan 2023-2026
Page | 3
Introduction
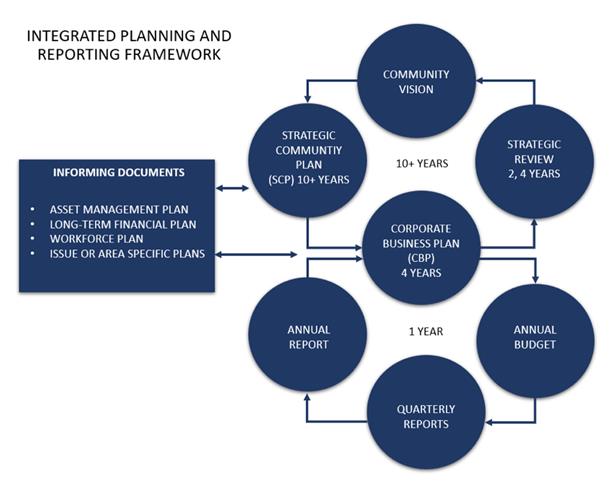
The City of Belmont’s WFP is a key organisational plan, forming part of the Integrated
Planning & Reporting Framework. Its purpose is to identify and outline workforce requirements
to deliver the CBP.
The WFP is divided into 7 sections:
1. About the City
This section articulates the City’s vision, values, strategic direction, structure, services and
priority projects.
2. Workforce Planning
This section explains what workforce planning is and provides a high-level overview of the
process undertaken.
3. Data Review and Analysis
This section provides a summary of the external environment including demographic data,
the labour market and the trends and drivers shaping the future of work. It also provides a
summary of the internal environment including demographic data, vacancy rates,
turnover, employees costs and training and development expenditure. This is followed by
an analysis of the external and internal factors.
4. Key Focus Areas
This section outlines the six KFAs and provides a summary of each.
5. Initiatives
This section identifies a number of initiatives designed to address the KFAs over the life of
the WFP.
6. Reviewing the WFP
This section summarises how the City plans to monitor and evaluate the WFP.
7. FTE Forecasts
This section provides a table of potential FTE forecasting.
The list of documents referenced in this WFP is contained within Appendix 1.
Workforce Plan 2023-2026
Page | 4
 About the City
Vision
City of Opportunity – We will be home to a diverse and harmonious community, thriving from
the opportunities of our unique, riverside City.
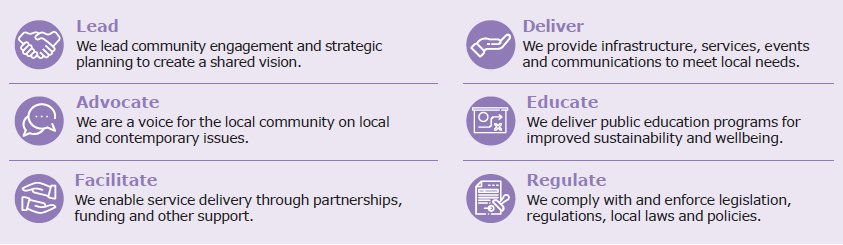
Purpose
The City of Belmont exists to enable and motivate the community by creating opportunities for
all to truly belong. We fulfil our purpose through the following roles:
Values
Values provide a foundation for the City, which distinguish us and guide our actions to deliver
results. Values guide our behaviours and provide the boundaries within which our interactions
occur. Values are linked to our vision, culture and strategy.
Value
Meaning
Leadership
To focus and inspire people to achieve.
Innovation
To create new, innovative and alternative ways of working.
Integrity
To act in an honest, professional, open and accountable manner.
Teamwork
People building relationships to work together to achieve common
goals.
People Focus
To work safely. To communicate and consult in order to understand
people’s needs.
Workforce Plan 2023-2026
Page | 5
 Our Plan for the Future
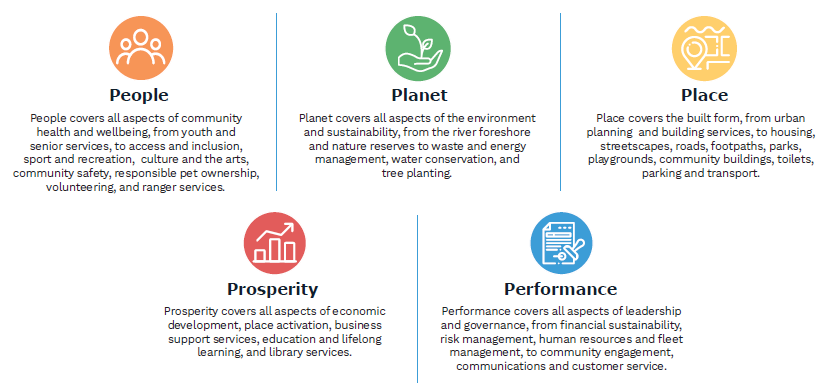
To achieve our Vision, the community helped to shape a plan for the future. Within the
framework are five key performance areas:
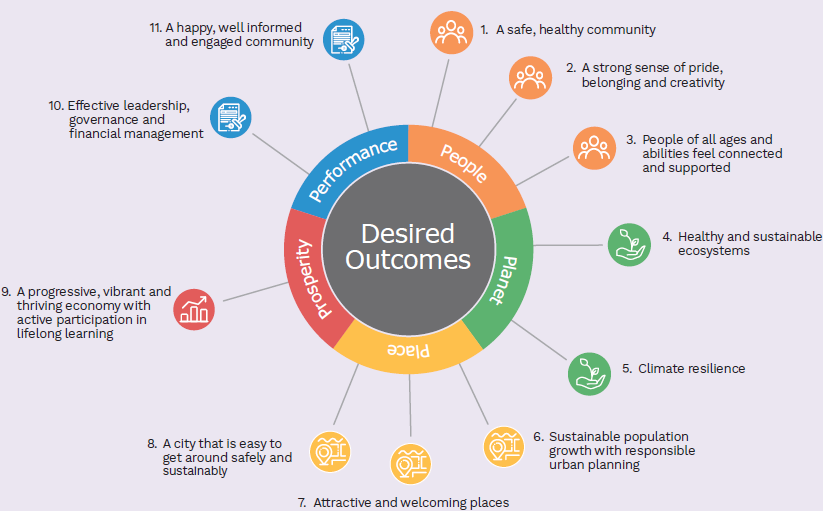
Outcomes
The City will strive to achieve 11 outcomes across the five performance areas. These
outcomes are interrelated and each must be satisfied to deliver excellent overall quality of life.
Workforce Plan 2023-2026
Page | 6
 Structure
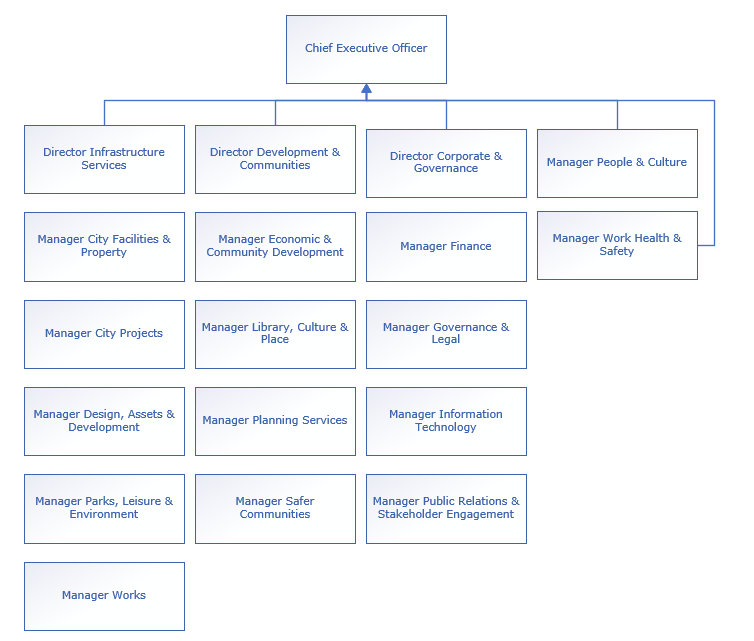
The City’s administration is arranged into three divisions and an Executive Services area,
comprising 15 departments that provide a range of community services, operations, facilities
and internal functions across the City. The leaders of each division make up the ELT, led by
the Chief Executive Officer.
The following structure was effective July 2024.
Workforce Plan 2023-2026
Page | 7
Services
The table below shows the services that each of the divisions and departments provide.
Division
Department
Services
Executive
CEO
• Internal Audit
Services
People & Culture
• Business Partnering
• Industrial/Employee Relations
• Workforce Planning
• Talent Management
• Employee Services
• Payroll Services
• Internal Communications
Work Health & Safety • Workers’ Compensation
• Injury Management
• Wellbeing
Development &
Economic &
• Economic Growth & Policy
Communities
Community
• Business Support
Development
• Tourism
• Community Development
• Youth Services
• Volunteer Management
• Community Engagement
• Access & Inclusion
• Healthy Communities
•
Library, Culture &
• Library
Place
• Museum
• Heritage & History
• Placemaking
• Arts & Culture
• Events
Planning
• Urban Design
• Subdivisions
• Planning Applications
• Compliance/Inspections
Safer Communities
• Local Emergency Management
• Local Law Enactment
• Environmental Health
• Community Safety & Crime Prevention
• Rangers
• Building Services
• Customer Services
Infrastructure
City Facilities &
• Construction Projects
Services
Property
• Building Services
• Facilities
• Property & Lease Management
• Property Development
• Acquisition & Disposal
City Projects
• Significant and Complex Project
Management
• Project Management Framework
Workforce Plan 2023-2026
Page | 8
Division
Department
Services
Infrastructure
Design, Assets &
• Asset Management
Services (cont’d) Development
• Road & Drainage Design
• Traffic Management
• Road Programs
• TravelSmart
• Project Design, Coordination & Delivery
• Apartment Developments
• Traffic Assessments
• Drainage
Parks, Leisure &
• Parks Facilities Maintenance & Management
Environment
• Parks Asset Management & Design
• Environmental Management
• Urban Forest
• Leisure & Recreation
Works
• Construction & Maintenance
• Engineering Inspections
• Roads & Drainage
• Fleet & Plant
• Waste
Corporate &
Finance
• Rates & Revenue
Governance
• Procurement
• Tenders & Contracts
• Grants
• Accounting
• Purchasing
• Creditors/Debtors
• Financial Management
•
Governance & Legal
• Strategic Organisational Planning, Research
& Innovation
• Analytics & Insights
• Strategic Reviews
• Business Excellence
• Improvement & Quality Assurance
• Governance
• Risk & Insurance
• Legal & Compliance
• Records Management
Information
• Business Applications
Technology
• WEB Administration
• Systems Administration
• IT Support
• Infrastructure & Licensing
• GIS Technology
• Digital Enablement
Public Relations &
• Brand Management
Stakeholder
• PR/Branding/Reputation
Engagement
• Marketing
• External Communication
• Media & Social Media
• Civic Events
• Surveys & Customer Feedback
Workforce Plan 2023-2026
Page | 9
 Workforce Planning
What is workforce planning?
All local governments are required to conduct workforce planning activities as part of the
Department of Local Government, Sport & Cultural Industries
Integrated Planning and
Reporting Framework (IPRF). Whilst this compliance aspect exists, it is not the driving force
behind why we undertake workforce planning. We do workforce planning to achieve the
following:
• To be able to respond to emerging challenges, before they are upon us.
• To have a productive and effective workforce that possesses the skills and knowledge
needed to perform.
• To forward plan workforce requirements so that critical gaps are accounted for.
• To inform the processes, technologies and systems we need to support an effective
workforce.
• To have the ability to deliver on the City’s SCP and CBP.
The WFP is one of the major informing strategy documents that comprises the IPRF as is
demonstrated in the diagram below.
The content of the WFP is guided by the SCP, which outlines the long-term vision and
aspirations of the City. The CBP then specifies the projects/initiatives and services the City will
be delivering, which must be resourced.
Workforce Plan 2023-2026
Page | 10
To achieve delivery of these projects/initiatives and services, we need to consider the
following:
• Do we need more people resources?
• Do we have the right skills?
• Do we have the systems and technology to achieve the projects in the timeframes set?
• Can the City afford these resources?
This is the role of a comprehensive workforce planning process. The outcome is the WFP which
is designed to close any gaps identified during the process and prepare our workforce for the
future.
The City’s Process for Development of the WFP
The development of the City’s WFP was facilitated by People & Culture with input from the
CEO, directors and managers. The following diagram shows the process that was undertaken
and when, followed by an indication of each step.
Review
Analyse
Key Focus
Develop
Environment
Environment
Areas
document
Jan-Feb 2023
Mar 2023
Apr-May 2023
May-Jun 2023
•
• Critical gaps.
• Identify main
• Write content
External
•
• Identify
areas of focus.
of WFP.
Internal
external and
•
Identify
internal factors.
Initiatives that
will address
key focus
areas.
Review of the Environment
External Environment
People & Culture researched the external environment and provided a report to ELT/OLT
covering three broad areas:
• demographic data;
• the labour market; and
• the trends and drivers shaping the future of work.
The 2021 census data for the community of the City of Belmont was reviewed. In particular it
focussed on the population, age, diversity (birthplace, ancestry, language, English proficiency
and religion) as well as education (schooling and qualifications) and occupations and
industries.
The labour market review considered the wage price index (WPI), consumer price index (CPI),
employment rates and the job vacancy rate. The CPI is gradually declining from an historical
high of 8.3% in December 2022, with Perth’s CPI falling faster than the weighted average for
Workforce Plan 2023-2026
Page | 11
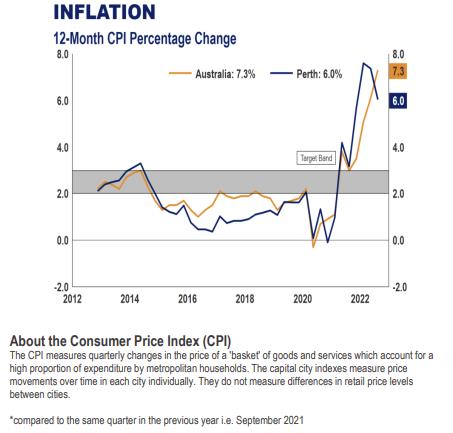
all states and territories at March 2024. Despite the slowing of the economy the labour market
remains strong. The last spike in CPI was in September 2008 when it reached 5%.
CPI – Comparing Australia and Western Australia – 2012-2022
Source: CCIWA, September 2022
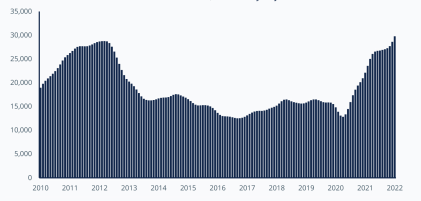
Conversely the unemployment rate has declined with historically low rates of unemployment
being experienced. The unemployment rate in WA continues to be around 3.4-3.6%, where it
has been sitting since December 2021. The diagram below shows internet job advertisements
for the period 2010-2022, which shows the rise in job opportunities in WA.
Internet Job Adverts – Western Australia - Seasonally Adjusted 2010-2022
Source: CCIWA, March 2022
Workforce Plan 2023-2026
Page | 12
In addition, the report looked at labour market forecasting for the life of the WFP. The
following table shows economic forecasts for WA, updated in July 2024.
Forecast
Forecast
Forecast
Forecast
Indicator
2024/2025
2025/2026
2026/2027
2027/2028
CPI
3%
2.5%
2.5%
2.5%
WPI
3.75%
3.5%
3.0%
3.0%
Unemployment Rate
4.0%
4.25%
4.5%
4.75%
Source: Government of Western Australia, 2024-25 Budget, Economic and Fiscal Outlook, Budget Paper No. 3
The research also identified four main trends and drivers related to the future of work
including technology, employee skills, flexible working arrangements and the ‘Great
Resignation’. A scan of the external environment in July 2024 identifies that these trends and
drivers remain relevant.
Technology
Many organisations in WA are planning to digitise and automate more of their operations by
shifting online, adapting to and expanding the use of mobile devices and applications and
maximising the benefits of cloud computing. Others are adopting smart, connected operations
and infrastructure, which are enabled by technologies such as AI (artificial intelligence) and
the IoT (internet of things).
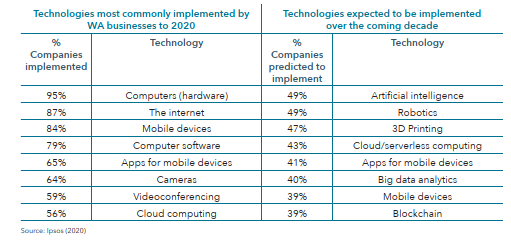
As expected, the mining and resources sector is leading the way in WA and is supported by a
digitally enabled and smart professional service industry. AI and automation are the
technological tools expected to be most commonly adopted in WA in the coming decade.
These technologies provide the potential to transform business operations and productivity.
Technologies Most Commonly Implemented by WA Organisations to 2020
and Predicted to be Implemented Over the Coming Decade
Source: Committee for Perth, 2021
Recent research has shown that Australian organisations are looking to technology for
productivity improvements, with high levels of adoption of key digital infrastructure such as
cyber security and cloud. More than half of Australian organisations are expecting to turn their
attention to AI, advanced data analytics and Internet of Things, which will require the
workforce to re-skill.
Workforce Plan 2023-2026
Page | 13
 Employee Skills – Employment Growth and Skills Shortages
In WA skilled employees are in short supply and human capital growth in WA has stagnated
with a comparative decline over the past two decades. This has resulted in WA facing a skills
deficit.
The education profile for WA reflects the skills of the past with an over-representation of
people with trade and technical qualifications associated with the mining sector. Conversely,
there is an under-representation of people with tertiary qualifications, with a notable decline in
people studying STEM (science, technology, engineering and mathematics) and ICT
(information and communication technologies). This poses a risk of mismatch of the skills
required and what is available.
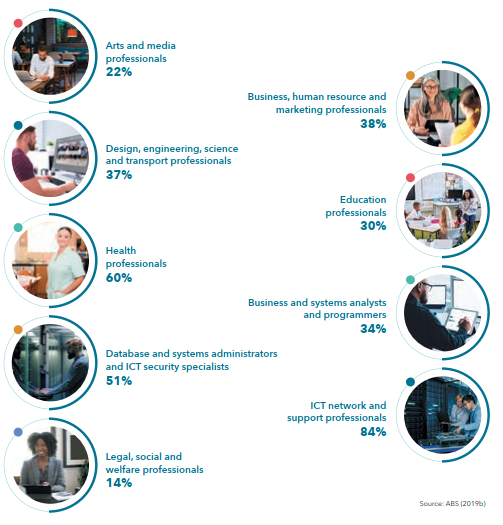
The occupations that have grown during the period 2010 to 2020 were health professionals;
database and systems administrators; ICT security specialists; ICT network and support
professionals; food trades; sports and personal service; hospitality workers; carers and aides.
The occupational group that has grown the most is professionals as shown in the figure below.
Growth in Professional Occupations – 2010-2020
Source: Committee for Perth, 2021
WA organisations have a long history of attracting skilled migrants from overseas. Whilst
skilled migration is increasing with the opening of WA borders, global mobility is not expected
to reach pre-pandemic levels for a considerable time. This means that the competition to
attract skilled employees will grow.
Workforce Plan 2023-2026
Page | 14
Recent research shows that whilst employment growth is slowing, organisations continue to
struggle recruiting due to skills shortages. To tackle this the most common approach is to
upskill the existing workforce.
Flexible Working Arrangements
Flexible working arrangements covers the ‘where, ‘when’ and ‘how’ of working. Whilst hybrid
working is the most preferred form of flexible work, it is not the only flexible working
arrangement sought by employees.
Research by Deloitte and University of Swinburne found that adopting an expansive
understanding of the definition of flexible work enables organisations to adopt a fair approach
to flexible working across their workforce, whether they are able to work remotely or not.
Flexible working delivers wellbeing outcomes primarily through its ability to moderate work-
life balance. In other words, flexible work delivers more time and control to the employee
which enables them to better prioritise their wellbeing at and outside of work. Research shows
that flexible work enables employees to realise life benefits that foster wellbeing.
Recent research shows flexible working arrangements continue to be a key issue for Australian
organisations and employees. The most popular working arrangement for full-time employees
remains hybrid working, with a minimum of 3 days/week in the workplace. The research also
shows hybrid working has a positive impact on productivity. There is also considerable interest
in the four-day week, working compressed hours e.g. 38 hours in 4 days.
The Great Resignation
This phenomenon started in the USA in 2021. By late 2021 research showed that Australia
was bracing for a similar trend. When employees were surveyed in late 2021, the results
showed signs of significant resignation intentions emerging in Australia.
Resignation Intentions
Source: RMIT, 2021
In February 2022 data showed that in Australia 9.5% of employed people had changed jobs
between February 2021 and February 2022. This was the highest mobility* rate since 2012
(10.5%).
*Job mobility is the number of people who changed jobs during the year as a proportion of people who were
employed at the end of the year.
The chart below shows the change in mobility rates since 1972. The 2022 figures show 9.1%
of males and 10% of females changed jobs. WA had the second highest mobility rate at
11.4% (after the ACT at 12.8%).
Workforce Plan 2023-2026
Page | 15
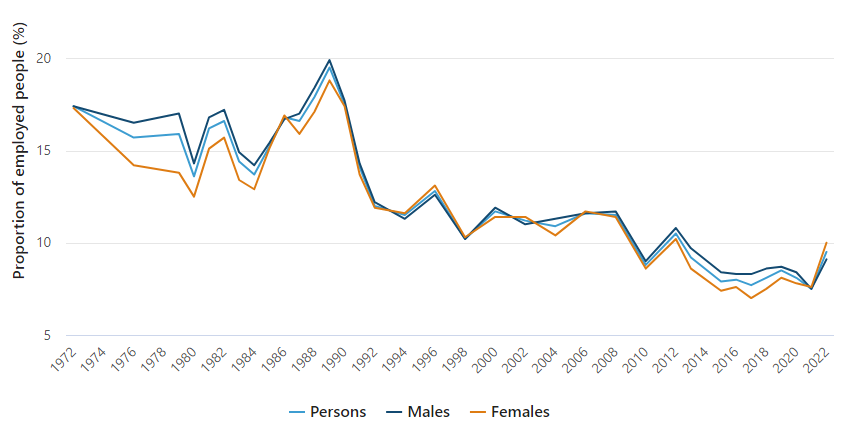 Employed People Who Changed Jobs During the Year Ended February 2022
Source: ABS
Employed People Who Changed Jobs During the Year Ended February 2022
Source: ABS
Recent research shows that The Great Resignation has peaked. However job mobility,
although declining, remains at historically high levels particularly in WA. WA’s mobility rate is
8.7% which is higher than the national average of 8%.
The drivers that motivate employees is nuanced and therefore can be different for different
cohorts. In WA research showed that there are differences in what factors are attractive for
each generation. The table below shows the views of employees in Perth across four different
generational types - Generation Z (under 25), Generation Y (25-41), Generation X (42-57)
and Baby Boomers (58+).
Generation
Work Drivers
Top 3 Factors from Work Drivers
Generation Z
Work-Life Balance – 22.3% • Additional leave
• Purchased leave and unpaid leave
• Flexible hours/Regular hours (equal third)
Career Development –
• On-the-job skill development/coaching
20.3%
• Promotional opportunities
• In-house training
Salary & Compensation –
• Paid overtime
11.9%
• Paid parental leave
• Base salary
Generation Y
Work-Life Balance – 26.5% • Flexible working hours
• Time-in-Lieu
• Additional leave
Salary & Compensation –
• Base salary
25.9%
• Salary review period
• Paid overtime
Career Development –
• On-the-job skill development coaching
15.7%
• Promotional opportunities
• In-house training programs
Generation X
Salary & Compensation –
• Base salary
26%
• Review period
• Hourly rate
Work-Life Balance – 24.6% • Remote working
• Time-in-Lieu
• Flexible arrangements
Organisation – 8.9%
• Respectful
• Supportive
• Transparent
Workforce Plan 2023-2026
Page | 16
Generation
Work Drivers
Top 3 Factors from Work Drivers
Baby Boomers Work-Life Balance – 27.8% • Able to work part time
• Time-in-lieu
• Remote working
Salary & Compensation –
• Base salary
17.6%
• Salary review period
• Hourly rate
Job Location – 12.2%
• Easy to drive/park
• Access to public transport
• Close to home
Source: Seek, 2022
Internal Environment
People & Culture also analysed internal data and provided a report to ELT/OLT covering four
broad areas:
• demographic data;
• vacancy rates;
• turnover; and
• employee costs and training and development expenditure.
The demographic section looked at the organisational profile from an FTE, headcount, gender,
age and length of service perspective.
FTE & Headcount 2023
The City’s workforce consisted of
202.69 FTE (full time equivalent, excludes casuals)
comprising a
headcount of 228 (includes 2 casual employees) in early February 2023.
The charts below show the number of FTE and headcount in each employment type for the
whole organisation.
FTE (202.69) - Organisation Profile
160
133.37
140
120
100
80
60
40
30
32.35
20
4
2.97
0
FULL
FULL
PART
FULL
PART
CONTRACT
PERM
TEMP
Workforce Plan 2023-2026
Page | 17
Headcount (228) - Organisation Profile
160
134
140
120
100
80
60
53
40
30
20
2
4
5
0
CASUAL
FULL
FULL
PART
FULL
PART
CASUAL
CONTRACT
PERM
TEMP
FTE & Headcount 2024
The City’s FTE (full-time equivalent) in mid July 2024 was 229.58, this was an increase of
26.89 FTE since the last report in early February 2023. This represents an 11.71% increase.
FTE (229.58) - Organisational Profile
160
149.98
140
120
100
80
60
36.03
40
29
20
10
4.57
0
CNTRCT
PERM
TEMP
PERM
TEMP
FULL
PART
Workforce Plan 2023-2026
Page | 18
The City’s Headcount in mid July 2024 was 257, this was an increase of 29 headcount since
the last report in early February 2023. This represents an 11.28% increase.
Headcount (257) - Organisation Profile
160
150
140
120
100
80
58
60
40
29
20
10
8
2
0
CASUAL
CNTRCT
FULL
PART
FULL
PART
CASUAL
CNTRCT
PERM
TEMP
Gender
The chart below shows the workforce in 2023 consisted of 54% female and 46% male
employees.
Gender - Organisation Profile
130
123
120
110
105
100
90
FEMALE
MALE
Workforce Plan 2023-2026
Page | 19
Age
The chart below shows the distribution of the workforce in 2023 based on age. When
analysing the data based on what is commonly referred to as ‘generations’, the following is
noted:
•
2.2% of the workforce is
aged 0-24 (Generation Z);
•
36.4% of the workforce is
aged 25-41 (Generation Y);
•
43.9% of the workforce is
aged 42-57 (Generation X); and
•
17.5% of the workforce is
aged 58+ (Baby Boomer).
Age - Organisation Profile
120
100
100
83
80
60
40
40
20
5
0
Age 0-24
Age 25-41
Age 42-57
Age 58+
Length of Service
Slightly over a third of the workforce (34.2%) in 2023 had joined the City in the previous two
years.
•
34.2% of the workforce has been with the City
up to 2 years.
•
13.6% of the workforce has been with the City between
2 and 5 years.
•
18.4% of the workforce has been with the City between
5 and 10 years.
•
17.1% of the workforce has been with the City between
10 and 15 years.
•
7.5% of the workforce has been with the City between
15 and 20 years.
•
4.8% of the workforce has been with the City between
20 and 25 years.
•
4.4% of the workforce has been with the City for
more than 25 years.
Length of Service - Organisation Profile
90
78
80
70
Sum of LoS 0-<2 Years
60
Sum of LoS 2-<5 Years
50
42
39
Sum of LoS 5-<10 Years
40
31
Sum of LoS 10-<15 Years
30
17
Sum of LoS 15-<20 Years
20
11
10
Sum of LoS 20-<25 Years
10
Sum of LoS 25+ Years
0
Total
Number of Employees/Years of Service
Workforce Plan 2023-2026
Page | 20
Vacant Positions
There were 278 active positions in mid July 2024. Of those, 251 were filled and 27* (9.7%)
were vacant.
Number of
% of
Number of % of Total
Division
Vacant
Positions
Positions
Positions
Positions
Vacant
Corporate & Governance
57
20.5%
5
8.8%
Development & Communities
101
36.3%
11
10.9%
Infrastructure Services
102
36.7%
10
9.8%
Executive Services
18
6.5%
1
5.5%
Totals
278
100%
27
N/A
*Of the 27 vacant roles, four have someone appointed, but are yet to commence (two in Corporate & Governance
and two in Infrastructure Services).
There has been a decrease in the vacancy rate across all divisions. However, the greatest
decrease is in Infrastructure Services which decreased from 24.7% in late February 2023 to
9.8% in mid July 2024.
Turnover
Turnover measures voluntary turnover for those employees who are leaving to go to another
organisation. It does not include those employees whose contracts ended through dismissal,
redundancy or retirement; those on temporary contracts that have a pre-determined end
date; or those on casual contracts. The City’s turnover for the past six financial years is as
follows:
Percentage
Number of
Percentage
Year
Exits
Turnover for Year Increase/Decrease
from Previous Year
2018-2019
29
10.7%
N/A
2019-2020
32
12.5%
+14.4%
2020-2021
25
10.8%
-15.7%
2021-2022
58
27.2%
+60.3%
2022-2023
39
19.1%
-42.4%
2023-2024
37
15.7%
-21.6%
There has been a decrease in turnover at the City since the peak of 2021-2022 (27.2%).
Recent research shows that the turnover rate for 2023-2024 (15.7%) is comparable to some
Australian organisations which averaged turnover of 15% for the year to March 2024. This
data was based on both public and private sector with the public sector reporting turnover of
23% and the private sector reporting turnover at 13%.
Workforce Plan 2023-2026
Page | 21
Employee Costs
One of the largest annual expenditures at the City is employee costs. The table below shows
the annual operating expenditure and employee costs ($ and %) for the last five financial
years.
Total Operating
Employee Costs
Percentage
Year
Expenditure
2018-2019
$63,216,029
$24,219.976
38%
2019-2020
$62,841,934
$25,318,996
40%
2020-2021
$63,164,148
$23,599,016
37%
2021-2022
$60,618,057
$21,738,145
36%
2022-2023
$66,354,276
$23,126,544
35%
Training/Development Costs
Training/development accounts for a very small portion of the annual expenditure at the City.
The table below shows the annual expenditure for training/development activities for the last
4 financial years.
Total Operating
Year
Training Costs
Percentage
Expenditure
2018-2019
$63,216,029
$246,123
0.39%
2019-2020
$62,841,934
$232,444
0.37%
2020-2021
$63,164,148
$95,611
0.15%
2021-2022
$60,618,057
$124,835
0.21%
2022-2023
$66,354,276
$194,102
0.29%
It should be noted that the reason for the significant decrease in 2020-2021 and 2021-2022
was due to the impacts of COVID-19.
Data Review and Analysis
The data and information from the internal and external environments have been considered,
along with the in-depth knowledge of directors and managers in relation to their own areas of
functional expertise.
There were also a number of external legislative and compliance factors identified that are
likely to impact the City. This includes:
• significant changes to the Public Health Act;
• ongoing Local Government Act reform;
• the likelihood of industrial reform at both the Federal and State level;
• proposed changes to the Workers Compensation & Injury Management Act 1981;
• changes to the State planning framework;
• ongoing constant changes to accounting standards and reporting formats;
• increased regulator activity in the work, health and safety space;
• ongoing OAG audits (including changes to ISO 27001 for IT information security
management systems and new Essential 8 adherence for cyber security); and
• net zero emissions implications.
Workforce Plan 2023-2026
Page | 22
The majority of internal factors impacting the City are captured by the following:
• a high turn-over/vacancy rate that has had flow-on effects across the organisation, this is
being exacerbated by the skills shortages in the market;
• a lack of investment in learning and development of our workforce;
• our ability to compete in the market (salary and other benefits) to attract and retain
employees;
• a need to improve the use of, and integration of, new and existing IT systems;
• the impact of disruption on the culture of the organisation;
• a lack of awareness or understanding across the organisation of what some business units
do; and
• regular reviewing of services and programs that affect structure to maintain a strategic
focus and ensure we optimise service delivery and increase accountability and
responsibility at the appropriate levels.
Key Focus Areas
The analysis identified key themes that were used to develop six KFAs.
1. Talent Acquisition
2. Talent Development
3. Employee Retention
4. Technology
5. Service and Program Review
6. Organisation Culture
A summary of each of the KFAs is outlined below.
Talent Acquisition
The impact of the external labour market has and continues to have an effect on the City. A
combination of the shrinking talent pool and high turnover has resulted in a high vacancy rate
across the organisation during the last 1-2 years. Whilst some areas have been successful in
recruiting replacement employees, it is acknowledged that some areas have been affected
more than others. Consequently this creates a flow-on effect to other areas that, in some
cases, has the potential to have an impact on the City’s ability to deliver on strategic projects,
capital works and operational activities.
Talent Development
It was acknowledged by the majority that the City needs to invest in the development of the
workforce. Whilst the City is being impacted by the skills shortages, a lack of development of
its existing workforce will exacerbate the situation. This is not just related to particular roles.
It was noted that there are a number of skills that apply across a broad range of roles. For
example, due to the technological advances the majority of the workforce will require
upskilling in digital skills.
There is a need to build internal capability so that we ‘grow our own’. Whilst this includes
developing emerging and existing leaders, we need to broaden our scope. This includes
developing initiatives that will promote cross-functional opportunities for advancement by
identifying and developing transferable skill sets that will build internal capability, enabling us
to not rely so heavily on the external market for our workforce.
Workforce Plan 2023-2026
Page | 23
Employee Retention
It is acknowledged that the City’s turnover in the past has not been high in comparison to
other local governments (this is supported by WALGA data). However, the City’s turnover has
been uncharacteristically high in the last 12-18 months. Whilst it is not as high as other local
governments, it is fair to say that this is not unusual in the current market and, it is important
that the City has a focus on retaining a skilled, productive and engaged workforce. This will
limit disruption to service delivery and reduce the negative impacts it has on the rest of the
workforce such as increased workload and loss of corporate knowledge, etc.
It is acknowledged that the City competes not only with other local governments, but also
State government and the private sector for its workforce. If we wish to retain employees, we
should ensure our salaries are competitive. In addition, there is a requirement to develop and
implement a range of contemporary initiatives and benefits that are tailored to the needs of a
diverse workforce. The City should ensure we keep the momentum moving forward when it
comes to flexibility in working arrangements.
Whilst it is important to gain a greater insight into why employees leave the City, it is just as
important to understand why people stay (and what would encourage them to stay if they
were contemplating leaving). This includes both long term employees and the large new
cohort who have joined in the last 1-2 years.
Technology
Unsurprisingly technology was a common theme raised by all. This space is evolving at a fast
pace, and it will require a concerted effort by the City to address the many challenges. This
includes a wide range of issues that will impact the workforce, for example:
• IT infrastructure reaching end of life;
• large scale IT projects that need to be planned and resourced;
• regular upgrades to existing platforms;
• the introduction of new platforms and technologies;
• moving to the Cloud requiring internal triaging of issues and liaison with external vendors
to resolve issues;
• integration of multiple systems and platforms; and
• centralised reporting systems.
To address these issues, the City needs to actively push digital transformation to increase
productivity and make outdated manual processes redundant. This will include process and
workflow optimisation and/or automation.
This needs to be balanced with maintaining the human connection with our customers
(internal and external). It was acknowledged that the majority of our workforce has varying
degrees of interaction with technology. We need to create the right environment by providing
digital skills learning opportunities and highlight the positive impact that technology can have
on their work.
Service & Program Review
It is important to regularly review the services that are delivered to the community and
programs that are implemented internally to evaluate their effectiveness. These regular
reviews will assist the City to:
• determine whether the current structure supports delivery of services in an effective and
efficient manner;
• determine the appropriateness of in-sourcing vs out-sourcing of services;
Workforce Plan 2023-2026
Page | 24
• determine whether existing services need to be modified in order to be responsive to the
increased expectations of the community and Council;
• identify and establish links and overlap between different areas;
• review roles to reduce inherent demarcation and ensure multi-skilling is incorporated to
enhance service delivery;
• identify FTE and work pattern pressure points and create/divert resources accordingly; and
• identify new programs that will add value and determine which existing programs require
review to ensure they are continuing to add value.
Organisation Culture
The City has been through a significant period of disruption to normal operations in the last
three years starting in early 2020 with the onset of COVID-19. In summary this includes the
following:
• making immediate decisions in response to COVID-19 in an environment that had not
been experienced by the City (or other organisations) before;
• responding to government mandates and lockdowns;
• an acknowledgement that as an organisation we were not set-up from a technology
perspective to facilitate lockdowns and some of the workforce working remotely;
• managing workload and resourcing during a time when the impacts of COVID-19 were
peaking;
• responding to increased community demands;
• managers being too operationally focussed; and
• experiencing the impacts of the Great Resignation with recent high turnover and the
resultant impact that has on the workforce.
This is having different impacts on both long-term employees and employees who have joined
in the last 1-2 years. Some of those that have been here for longer may be struggling with the
effects of change, whilst those that are new to the organisation are bringing in new ideas and
challenging (with good intentions) current ways of doing things including systems, processes,
tasks, etc.
Initiatives are required to ensure the culture at the City is positive and engenders a stronger
focus on building employee engagement and trust.
Workforce Plan 2023-2026
Page | 25
Initiatives
The City has considered each of the KFAs and developed a number of Initiatives designed to address them. These are outlined in the table
below. Each Initiative has a team that will take the lead and be responsible and accountable for delivery. Each Lead will require input
and/or support from different parts of the organisation (referred to as a Partner).
TALENT ACQUISITION – Identifying and acquiring employees who are capable and motivated to deliver organisational
objectives.
Initiatives
Responsibility
When
2023/2024
2024/2025
2025/2026
1. Define the City’s Employee Value Proposition (EVP). The
Lead - People & Culture
EVP should be designed to:
Partners - Employees
• clearly communicate the benefits of working at the
X
X
City; and
• is attractive to prospective employees.
2. Develop an apprenticeship program designed to create a
Lead - People & Culture
pipeline of future employees. The program should be
Partners - Managers
designed to:
• target those areas where there are skills shortages;
and
X
X
• introduce participants to the opportunities for
employment within the local government industry
and the City specifically.
3. Implement the apprenticeship program creating a
Lead – Managers and
pipeline of future employees.
Supervisors
Partners - People & Culture
X
X
Workforce Plan 2023-2026
Page | 26
Initiatives
Responsibility
When
2023/2024
2024/2025
2025/2026
4. Undertake a review of the current recruitment and
Lead - People & Culture
selection process. The review should result in the
Partners - Managers
development and implementation of a streamlined
process that:
X
X
• showcases the City as an employer of choice; and
• provides a great candidate experience.
5. Implement the recommendations from the review of the
Lead - Managers and
recruitment and selection process.
Supervisors
X
X
Partners – People & Culture
6. Develop an onboarding program for new employees
Lead - People & Culture
designed to engage with and create connections prior to
Partners – Employees
X
commencement.
7. Implement the onboarding program.
Lead - People & Culture
Partners – Managers and
X
X
Supervisors
TALENT DEVELOPMENT – Develop employees’ skills and knowledge to position them for career advancement and deliver on
organisational objectives.
Initiatives
Responsibility
When
2023/2024
2024/2025
2025/2026
1. Develop a Talent Management Strategy that increases
Lead – People & Culture
capability and capacity of the workforce.
Partners – Directors and
X
X
Managers
2. Implement the Talent Management Strategy.
Lead – People & Culture
Partners – Directors and
Managers
X
X
Workforce Plan 2023-2026
Page | 27
Initiatives
Responsibility
When
2023/2024
2024/2025
2025/2026
3. Review the Leadership Strategy to identify:
Lead – People & Culture
Partners – Directors and
• key accountabilities and responsibilities designed to Managers
boost strategic and operational productivity; and
X
• key behaviours and practices including, but not
limited to, coaching and mentoring employees to
cultivate a proactive and positive work environment.
4. Implement the Leadership Strategy.
Lead – Directors and
Managers
Partners – People & Culture
X
5. Develop and implement people management policies
Lead – People & Culture
and associated frameworks that ensure compliance with
Partners – Directors and
legislative obligations.
Managers
X
6. Implement education and training to supervisors and
Lead – People & Culture
employees.
Partners – Directors and
X
X
X
Managers
7. Undertake a review of the current Staff Development
Lead – People & Culture
Review process.
Partners – Directors and
X
X
Managers
8. Implement the recommendations from the review of the
Lead – Directors and
Staff Development Review process.
Managers
X
X
Partners – People & Culture
9. Undertake a review of the current Study Assistance
Lead – People & Culture
process and implement recommendations.
Partners – Directors and
Managers
X
Workforce Plan 2023-2026
Page | 28
EMPLOYEE RETENTION – Foster a positive work environment to promote engagement and retain productive and talented
employees.
Initiatives
Responsibility
When
2023/2024 2024/2025 2025/2026
1. Undertake a review of the current employee exit
Lead – People & Culture
process.
Partners - Employees
X
X
2. Implement the recommendations from the review of the
Lead – People & Culture
employee exit process.
Partners – Directors and
X
Managers
3. Develop a mechanism to monitor employee
Lead – People & Culture
engagement during the employment life cycle.
Partners – Directors and
Managers
X
4. Implement the mechanisms to identify and improve
Lead – Directors and
employee engagement during the employment life
Managers
cycle.
Partners – People & Culture
X
5. Undertake remuneration benchmarking.
Lead – People & Culture
Partners – Directors
X
X
TECHNOLOGY – Actively encourage digital transformation to identify opportunities to augment routine/repetitive tasks so
that employees can focus on optimising productivity whilst retaining human connection.
Initiatives
Responsibility
When
2023/2024 2024/2025 2025/2026
1. Support delivery of the City’s Information Technology
Lead – Information
Strategy.
Technology
Partners – Directors and
X
X
X
Managers
Workforce Plan 2023-2026
Page | 29
Initiatives
Responsibility
When
2023/2024 2024/2025 2025/2026
2. Review current manual process and, where practical,
Lead – Directors and
transfer to digital platforms using automated workflows. Managers
Partners – Information
X
X
X
Technology
3. Review existing digital workflows and identify
Lead – Directors and
opportunities to streamline.
Managers
Partners – Information
X
X
X
Technology
4. Review existing platforms and systems and identify
Lead – Directors and
opportunities to integrate existing and replacement
Managers
systems that are in alignment with the City’s strategic
Partners – Information
X
X
X
intent for technology.
Technology
SERVICE AND PROGRAM REVIEW – Regularly review service provision to evaluate effectiveness and relevance to the
community taking into account Council and community expectations. Identify new internal programs that will add value and
determine which existing programs require review to ensure they are continuing to add value.
Initiatives
Responsibility
When
2023/2024 2024/2025 2025/2026
1. Develop a framework for reviewing and evaluating
Lead – Directors
services delivered to the community. The framework
Partners – Managers
should be designed to ensure:
• service provision remains appropriate, effective and
X
X
efficient; and
• is aligned with the strategic objectives set out in the
SCP.
2. Implement the framework for reviewing and evaluating
Lead – Managers
services delivered to the community.
Partners – Directors
X
X
Workforce Plan 2023-2026
Page | 30
Initiatives
Responsibility
When
2023/2024 2024/2025 2025/2026
3. Identify opportunities to streamline and improve
Lead – Managers
service delivery.
Partners – Directors
X
X
X
4. Increase workforce resilience to respond to changing
Lead – Directors
workplace expectations.
Partners – Managers
X
X
X
5. Develop a framework for reviewing and evaluating
Lead – Directors
existing and new internal programs.
Partners – Managers
X
6. Implement the framework for reviewing and
Lead – Managers
evaluating existing and new internal programs.
Partners – Directors
X
ORGANISATION CULTURE – Create a culture that builds trust and supports employees to proactively contribute to a high-
performing workplace.
Initiatives
Responsibility
When
2023/2024
2024/2025
2025/2026
1. Develop and implement an Internal Communication
Lead – People & Culture
Strategy. The Strategy will be designed to:
Partners – Directors and
Managers
• ensure communications are engaging, appealing,
inclusive and respectful;
• ensure all employees are informed about upcoming
X
X
X
changes/executive decisions;
• foster an environment of feedback and
participation at all levels; and
• celebrate positive internal outcomes and
achievements.
Workforce Plan 2023-2026
Page | 31
Initiatives
Responsibility
When
2023/2024 2024/2025 2025/2026
2. Identify and implement opportunities to share
Lead – Directors and
information with the workforce through appropriate
Managers
mediums with a focus on face-to-face communication.
Partners – People & Culture,
X
X
X
Employees
3. Identify and implement an organisation culture
Lead – People & Culture
program.
Partners – Directors and
X
X
X
Managers
4. Undertake a review of the current induction process.
Lead – People & Culture
Partners – Directors and
X
X
Managers
5. Implement the recommendations from the review of
Lead - People & Culture,
the induction process.
Managers and Supervisors
Partners – Employees
X
X
Workforce Plan 2023-2026
Page | 32
Reviewing the WFP
The WFP will be reviewed annually to:
• reflect any changes in the SCP and CBP;
• to identify potential new trends and drivers from a scan of the external environment;
• to identify any potential areas of concern from a scan of the internal environment;
• ensure the Initiatives are still ‘fit for purpose’; and
• review forecast FTE and other relevant data to ensure accurate input into the long-term
financial plan.
In addition, a report will be provided to ELT annually that provides an update on the progress
of the Initiatives. Whilst People & Culture will prepare the annual report, responsibility for
input into the report will sit with the relevant ‘Leads’ and ‘Partners’.
Any changes as a result of the review process will be made to the WFP and communicated to
the wider workforce.
Workforce Plan 2023-2026
Page | 33
FTE Forecasts
The table below outlines the indicative FTE that may be required to support delivery of the CBP. These positions are subject to both
business case and budget processes.
Department
FTE Forecast
2023-2024
2024-2025
2025-2026
Information Technology
• 3.6FTE plus 2-
2.1FTE
1.5FTE
3FTE temporary
• 1.5FTE Business
• 1FTE Cyber Security
Analyst
• 0.5FTE Desktop
• 0.6FTE GIS
Support Officer
• 2-3FTE temporary
Replace Pathway for
CRM System
Economic & Community
• 1.2FTE
1.2FTE
Development
• 1.0FTE Community
Development Officer
• 0.2FTE Community
Engagement Officer
Planning Services
• 0.5FTE
0.4FTE
• 0.4FTE Planning
Project Officer
Safer Communities
• 3.0FTE
2.0FTE
1.0FTE
• 1.0FTE EHO
• 1.0FTE Ranger Admin
• 1.0FTE Building
Officer/Cadet
Workforce Plan 2023-2026
Page | 34
Department
FTE Forecast
2023-2024
2024-2025
2025-2026
Library, Culture & Place
• 2.4FTE plus
2.4FTE
0.6FTE
• 1.2 FTE for Arts &
temporary
Place
• 0.8FTE Collection
Management Officer
• 0.4FTE increase to
Specialist -
Collections to bring
the position up to
full-time
• 0.6FTE temporary
part-time Digital
Systems
Works
• 2.0FTE
2.0FTE Temporary
Temporary
• 1.0FTE Temporary
Admin Officer
• 1.0FTE Temporary
Customer Service
Officer
Parks, Leisure &
• 8.25FTE
3.0FTE
5.25FTE
Environment
• 3.0FTE Apprentices
• 1.0FTE Apprentice
• 2.0FTE Streetscapes
• 2.0FTE Environment
• 0.25FTE Recreation
Admin
Workforce Plan 2023-2026
Page | 35
Appendix 1 - Sources
Australian Bureau of Statistics, Job Mobility February 2022 released 24 May 2022, February
2023 released 30 June 2023 and February 2024 released 9 July 2024.
Australian HR Institute, Hybrid & Flexible Working – Practices in Australian Workplaces in
2023, October 2023
Australian HR Institute, Quarterly Australian Work Outlook – A forward-looking view of the
Australian labour market, September Quarter 2023, December Quarter 2023, March Quarter
2024 and June Quarter 2024
Chamber of Commerce & Industry Western Australia; CPI, September 2022.
Chamber of Commerce & Industry Western Australia; “Outlook”; released March 2022.
Chamber of Commerce & Industry WA, CCIWA Business Confidence Survey, March 2024
Committee for Economic Development of Australia’s, Economic and Policy Outlook 2024,
released in February 2024
Committee for Perth; “The Future of Work – Equipping WA and its people to lead the Nation in
the future world of work”; 2021.
Deloitte and Swinburne Edge Report; “Reset, Restore, Reframe – Making Fair Work
FlexWork”; June 2022.
Department of Local Government, Sport & Cultural Industries, Workforce Planning – The
Essentials, 2012.
Gartner Global Talent Monitor, Q4 2023,
Gartner HR Survey Finds Australian Employees Are
Looking for Career and Organizational Stability in 2024, 14 February 2024
Government of Western Australia, Western Australia State Budget 2024-2025, Budget Paper
3, Economic and Fiscal Outlook,
https://www.ourstatebudget.wa.gov.au/budget-papers.html, KPMG, Unlocking capabilities to uplift service experience, Public Sector Network Local
Government Roadshow, 2024.
Local Government Professionals Australia WA, 2023 Local Government Workforce Shortage
Survey in Western Australia, August 2023.
Royal Melbourne Institute of Technology & Deloitte Access Economics; “Ready-Set-Upskill,
Fast track growth with digital skills”; 2022.
Seek; “Laws of Attraction”; June 2022.
Western Australian Local Government Association, Economic Briefing, June 2024
Western Australian Local Government Association, Salary and Workforce Survey 2023
Workforce Plan 2023-2026
Page | 36