


FOI 24-91
OFFICIAL
Short Term Noise Monitoring – Primrose Sands, December 2024
Short Term Noise Monitoring
Program, Primrose Sands
11 June 2024 – 12 December 2024
Page 1
Page 1 of 19
OFFICIAL

FOI 24-91
OFFICIAL
Short Term Noise Monitoring – Primrose Sands, December 2024
Version Control
Version
Date
Comments
Sections
1.0
12 December 2024
Initial Version
All
Summary
D e p l o y m e n t P u r p o s e
This deployment aims to capture noise levels in support of the Noise Abatement Procedure
(NAP) trial, which commenced in June 2024. Specifically, it focuses on capturing noise levels of
arrivals using the RNP-AR approach and the longer RNAV approach to RWY 30.
D e p l o y m e n t m o n i t o r i n g P e r i o d
11 June 2024 – 12 December 2024
M o n i t o r i n g D e t a i l s
Capture zone: 2.5km radius x 8,202ft (2,500m) altitude.
Noise threshold settings by time of day: 00:00-07:59 = Threshold 51dB(A), 08:00-13:59 =
Threshold 55dB(A), 14:00-20:59 = Threshold 52dB(A), 21:00-23:59 = Threshold 50dB(A)
K e y F i n d i n g s
• Noise Correlation
92.6% of the aircraft from Hobart Airport, as per the focus group, generated noise
events that correlated to the aircraft.
• Noise Daily Distribution
The distribution of the maximum noise levels generated by aircraft falls within the
following ranges:
- 76.9% within the range of 60dB(A) to 70dB(A)
- 22.2% greater than 70dB(A).
- 0.9% below 60dB(A).
• Most Common aircraft
The most prevalent aircraft type during the deployment period was the B738 aircraft.
• Top loudest noise events
The top 10 noise events for this deployment originated from community sources.
Additionally, the top 10 correlated noise events were associated with community
sources in addition to aircraft noise.
• Busiest Day
The purpose was to analyze the day that had the most significant impact on the
community. The busiest day during the deployment period occurred on 11 June 2024.
Page 2
Page 2 of 19
OFFICIAL

FOI 24-91
OFFICIAL
Short Term Noise Monitoring – Primrose Sands, December 2024
Glossary of Terms
A
Arrivals
Background noise Level
The noise level in dB(A) that is exceeded 90% of the time. It is considered
(L90)
the background noise level of an environment.
Capture Zone
The region relative to the noise monitor that an aircraft can be within and
be able to be correlated to a noise event.
Correlated Noise Event
A noise event matched to an aircraft movement that flew through the
(CNE)
capture zone.
D
Departures
The degree of data completeness achieved during the deployment period.
Data Availability
The data availability percentage factors in any monitor outages that occur.
Day
6:00am-10:00pm
dB(A)
A-weighted decibel. It is an expression of the relative loudness of sounds
as perceived by the human ear.
General Aviation
Movements other than scheduled commercial airline operations. This
includes private, sports, charter and training operations.
H
Helicopter operations
LaMax
Each noise event will have a peak noise level which is referred to as the
maximum sound level in dB(A) or LaMax
Movement
An aircraft operation, such as an arrival or departure
Night
10:00 pm to 6:00 am
NMT
Noise Monitoring Terminal also referred to as the noise monitor.
A noise event is created when the noise level exceeds the threshold
Noise Event
settings for a specified period.
O
Overflight i.e. an aircraft movement that flew over the area but did not arrive
or depart from the airport of concern.
The total number of correlated noise events (CNE) is divided by the total
Overall Correlation
number of aircraft movements through the capture zone to calculate the
Percentage
overall correlation percentage.
RWY
Runway
An operation by an aircraft that arrives and departs on a runway without
T
stopping or exiting the runway. It is also known as Touch and Go.
The threshold represents the value that the noise level must surpass for a
Threshold
specified period to create a noise event.
YMHB
Hobart Airport, Tasmania
Page 3
Page 3 of 19
OFFICIAL
link to page 1 link to page 2 link to page 2 link to page 3 link to page 5 link to page 6 link to page 6 link to page 6 link to page 8 link to page 11 link to page 11 link to page 12 link to page 15 link to page 15 link to page 16 link to page 17 link to page 17 link to page 17 link to page 17 link to page 18 link to page 18 link to page 18 link to page 18 link to page 19

FOI 24-91
OFFICIAL
Short Term Noise Monitoring – Primrose Sands, December 2024
Table of Contents
Short Term Noise Monitoring Program, Primrose Sands ............................... 1
Version Control ................................................................................................. 2
Summary ............................................................................................................ 2
Glossary of Terms ............................................................................................. 3
1 Purpose .......................................................................................................... 5
2 Deployment Details ........................................................................................ 6
3 Findings .......................................................................................................... 6
3.1. Noise Correlation Summary ................................................................................................... 6
3.2. Daily Distribution of Correlated Noise Events ......................................................................... 8
3.3. Most Common Aircraft.......................................................................................................... 11
3.4. Top 10 Correlated Aircraft .................................................................................................... 11
3.5. Noise Event Analysis ........................................................................................................... 12
4 Busiest Day Analysis ................................................................................... 15
4.1. Discussion ............................................................................................................................ 15
4.2. Busiest Day Graph ............................................................................................................... 16
4.3. Busiest Day Noise Levels ..................................................................................................... 17
5 Further Information ...................................................................................... 17
5.1. Airservices Australia ............................................................................................................. 17
5.2. WebTrak ............................................................................................................................... 17
6 Appendix ...................................................................................................... 18
6.1. Noise Event Detection Details: ............................................................................................. 18
6.1.1.
Threshold Settings ............................................................................................... 18
6.1.2.
Aircraft and Noise Event Correlation .................................................................... 18
6.2. Calibration Check ................................................................................................................. 19
Page 4
Page 4 of 19
OFFICIAL

FOI 24-91
OFFICIAL
Short Term Noise Monitoring – Primrose Sands, December 2024
1 Purpose
The short-term noise monitoring program targeted locations in suburbs chosen by Airservices
Australia with consideration for community feedback. This deployment aims to capture noise
levels in support of the Noise Abatement Procedure (NAP) trial, which commenced in June
2024. Specifically, it focuses on capturing noise levels of arrivals using the RNP-AR approach
and the longer RNAV approach to RWY 30. Furthermore, an extensive analysis was conducted
for the busiest day of the deployment period. This day was chosen for its potential to provide
significant statistical data and insight into a day that had the greatest impact on the community
during the deployment. The analysis provided details of the loudest noise events experienced
and the most prevalent aircraft operations observed.
To adequately depict the variation in flight paths, weather conditions, and operational patterns
from Hobart Airport movements during the trial, a monitoring period from 11 June 2024 to 12
December 2024 was deemed sufficient. However, the monitor will remain in place as part of the
ongoing short term monitoring program.
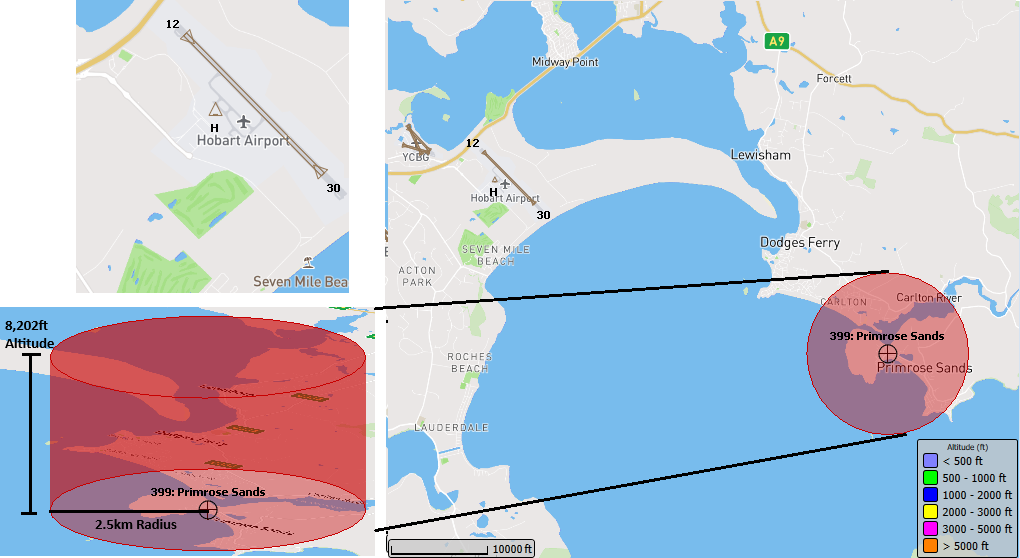
This short-term monitor was deployed in Primrose Sands. The noise monitoring terminal (NMT)
was positioned to capture aircraft within a three-dimensional cylinder capture zone. The zone
spans a radius of 2.5km and extends to 8,202ft (2,500m) above the NMT site level as depicted
in Figure 1. Considering that the focus group of aircraft operate below 5,000ft (1,524m), a ceiling
of 8,202 (2,500m) was adopted to accommodate potential variations.
The Focus Group for this deployment consists of aircraft operating to the east of Hobart Airport
which include:
• Fixed-wing jet aircraft arriving to runway 30 of YMHB.
Figure 1: NMT Correlation Zone
Page 5
Page 5 of 19
OFFICIAL
link to page 6 link to page 6

FOI 24-91
OFFICIAL
Short Term Noise Monitoring – Primrose Sands, December 2024
2 Deployment Details
The Primrose Sands monitor was installed on 10 June 2024. Complete data is available from
11 June 2024 to 12 December 2024.
NMT ID
399
Deployment Period
11/06/2024 – 12/12/2024
Location
Carlton Bluff Road, Primrose Sands, 7173
NMT Altitude
65ft (20m)
Capture Zone
2.5km radius x 8,202ft (2,500m) altitude
Data Availability
98.1%
The noise detection thresholds which have been selected:
• 00:00-07:59 = Threshold 51dB(A)
Threshold Settings1
• 08:00-13:59 = Threshold 55dB(A)
• 14:00-20:59 = Threshold 52dB(A)
• 21:00-23:59 = Threshold 50dB(A)
Table 1: NMT Details
3 Findings
3.1.
Noise Correlation Summary
The total number of aircraft correlated noise events (CNEs) that were captured by the noise
monitor during the 6-month deployment period is shown in Table 2 below.
Hobart Airport
Hobart Airport
All Movements2
Movements
Focus Group
Number of Movements
1772
1571
1518
through capture zone
Number of CNE
1571
1430
1405
Correlation Summary
88.7%
91.0%
92.6%
Table 2: Aircraft correlation rate
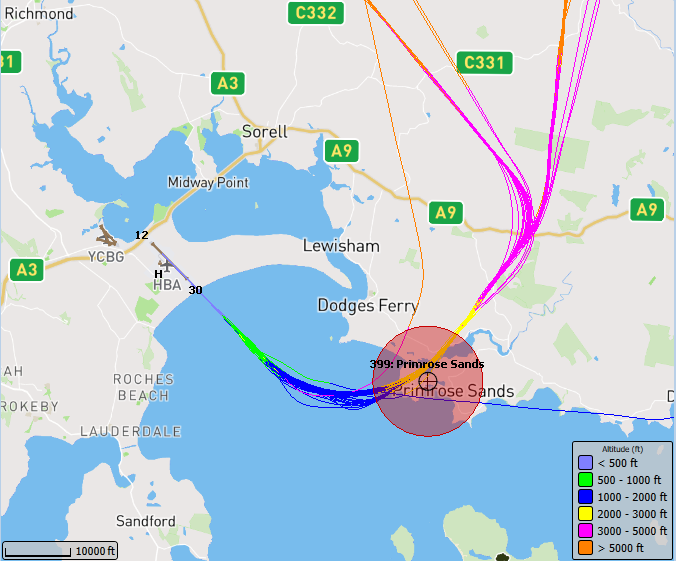
88.7% of all operations that passed through the capture zone were Hobart Airport movements.
A one-week sample of these movements is shown in Figure 2, below. Other operations included
traffic from other airports, such as Hobart Cambridge and Edinburgh Airports. A correlation of
92.6% was achieved for the focus group of Hobart Airport movements.
1 Threshold setting procedures are explained in section 6.1.1.
2 All-movement tab accounts for operations to and from other airports (E.g. Hobart Cambridge and Edinburgh Airports)
as well as YMHB operations.
Page 6
Page 6 of 19
OFFICIAL

FOI 24-91
OFFICIAL
Short Term Noise Monitoring – Primrose Sands, December 2024
Figure 2: One week of Hobart Airport flight tracks passing through the correlation zone
The findings obtained during the short-term deployment at Primrose Sands are as follows:
• Arrival runway 30 accounts for 98.3% of the operations from Hobart Airport over the
noise monitor.
• Departure runway 12 accounts for 0.8% of the operations from Hobart Airport over the
noise monitor.
• The average LaMax and highest LaMax for arrival and departure runways are detailed
in Table 3, below.
Average LaMax
Highest LaMax
Operation Type
Runway
noise dB(A)
dB(A)
Hobart Airport Arrival
30
69.3
84.7
Hobart Airport Departure
12
62.4
66.6
Table 3: Average LaMax and highest LaMax noise levels corresponding to each runway.
Page 7
Page 7 of 19
OFFICIAL
link to page 8 link to page 8

FOI 24-91
OFFICIAL
Short Term Noise Monitoring – Primrose Sands, December 2024
3.2.
Daily Distribution of Correlated Noise Events
A summary of the total number of correlated noise events by time of day, and the minimum to
maximum number of CNE on any day, are summarized below in Table 4.
Min
Max
Day Time Count
Night-time Count
Correlated Noise
number of
number of
(6:00am-
(10:00pm-
Event (CNE)
CNE per
CNE per
10:00pm)
6:00am)
day
day
N- Abov
e3 50 dB(A)
1449
4
1
18
(
N50+4)
N- Above 60 dB(A)
1435
4
1
17
(N60+4)
N- Above 70 dB(A)
334
0
0
9
(N70+4)
Table 4: Total correlated noise events during deployment period by time
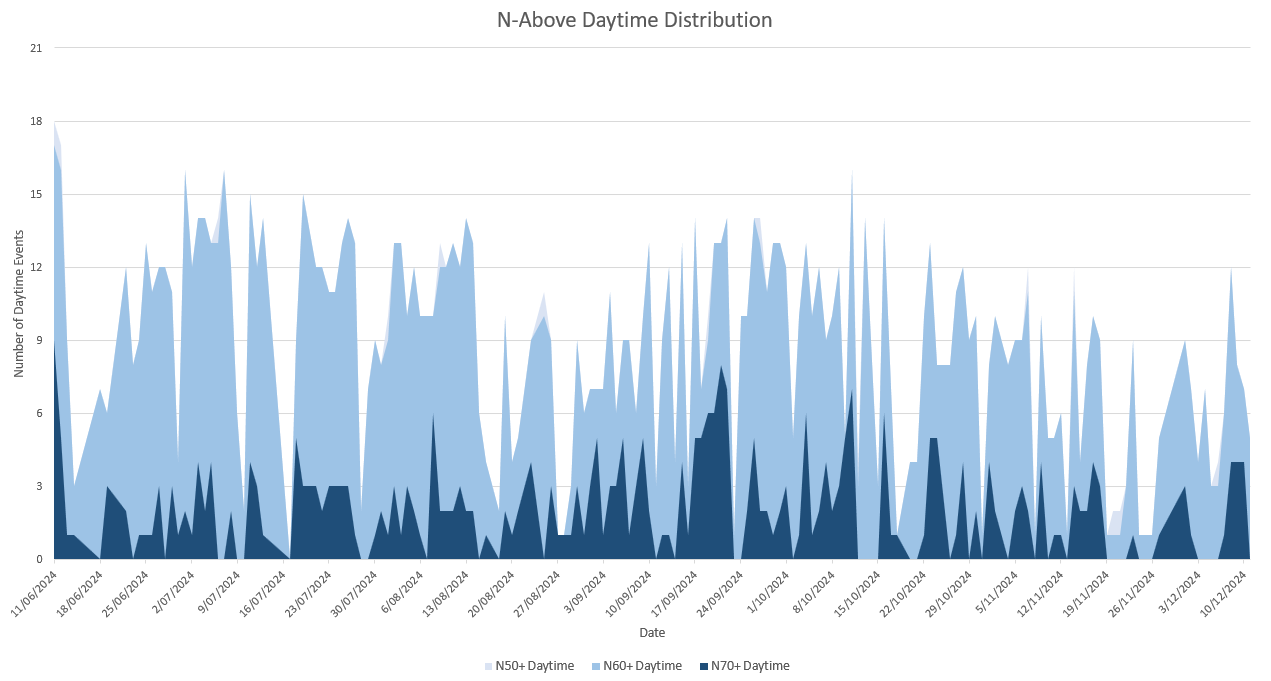
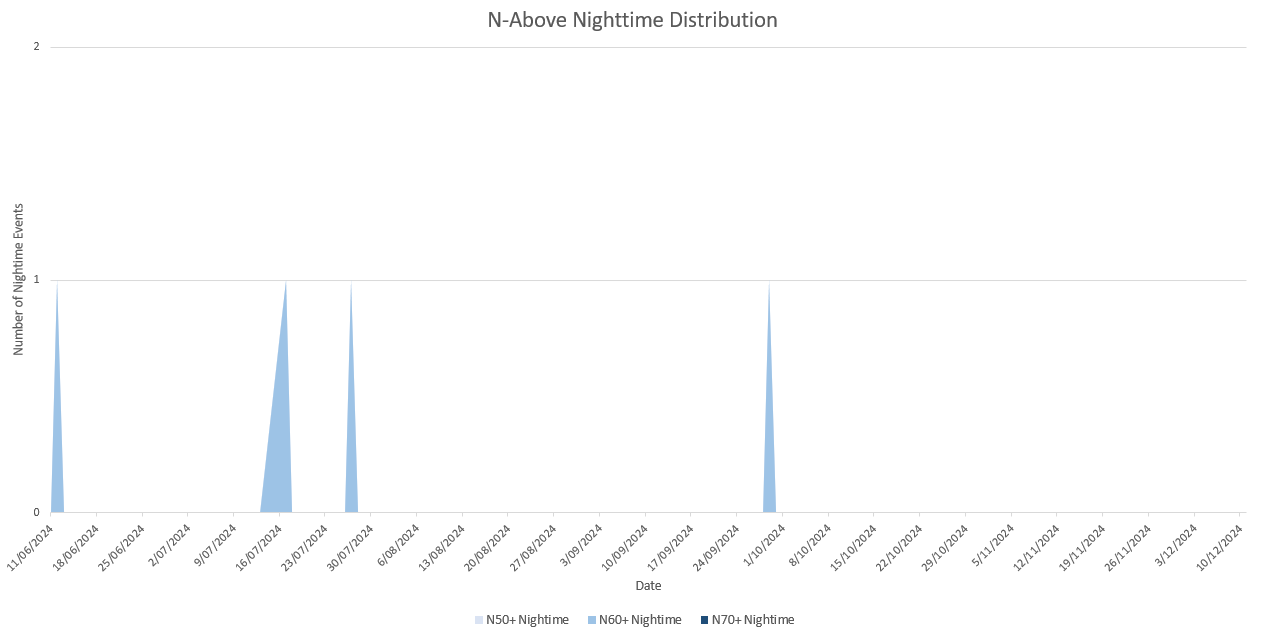
Examination of the N-above distribution values in Figure 3 and Figure 4 (below) show that the
highest daytime noise levels (N70+) were recorded on 11 June 2024. 76.9% of the maximum
noise level generated by aircraft falls within a range of 60dB(A) to 70dB(A), 0.9% of the
maximum noise level generated by aircraft is less than 60dB(A) and 22.2% of the maximum
noise level generated by aircraft is greater than 70dB(A).
3 N-above (or Number-above) is defined as the number of noise event with a LaMax above the specified (eg.N50+)
value.
4 N50+, N60+, N70+ are expressed as number of noise events with a LaMax above 50dB(A), 60 dB(A) and 70 dB(A),
respectively.
Page 8
Page 8 of 19
OFFICIAL

FOI 24-91
OFFICIAL
Short Term Noise Monitoring – Primrose Sands, December 2024
Figure 3: Daytime Daily N-Above Distribution Graph
Page 9
Page 9 of 19
OFFICIAL

FOI 24-91
OFFICIAL
Short Term Noise Monitoring – Primrose Sands, December 2024
Figure 4: Nighttime Daily N-Above Distribution Graph
Page 10
Page 10 of 19
OFFICIAL
link to page 11

FOI 24-91
OFFICIAL
Short Term Noise Monitoring – Primrose Sands, December 2024
3.3.
Most Common Aircraft
The most common aircraft type that flew through the zone during the deployment period is a
B738 aircraft as shown in Table 5, below.
Hobart Airport
Operations
Correlated %
Operation Type
Arrival
832
93%
Departure
2
50%
Touch and Go
0
0%
Overflight
0
0%
Table 5: B738 correlation percentage across the deployment period
3.4.
Top 10 Correlated Aircraft
The following table shows the top 10 average and maximum noise levels of correlated noise
events (CNEs) for the deployment period from 11 June 2024 to 12 December 2024. The highest
average LaMax of 70 dB(A) is attributed to BCS3 jet arriving to runway 30, shown in Table 6.
Aircraft
Aircraft
Airport Operation
Total
Average
Max5
Type
Category
Code
Type
Runway
CNE
LaMax dB(A)
dB(A)
B738
J
YMHB
A
30
826
69.8
84.7
A320
J
YMHB
A
30
375
68.8
77.8
BCS3
J
YMHB
A
30
58
70
83.5
SF34
T
YMHB
A
30
47
67.2
73.5
B712
J
YMHB
A
30
44
67.6
72.8
E190
J
YMHB
A
30
34
68.8
72.2
BE20
T
YMHB
A
30
22
63.9
66.8
A21N
J
YMHB
A
30
20
67.8
72
A321
J
YMHB
A
30
18
68.7
74.8
BE20
T
YMHB
D
12
10
61.4
64
Table 6: Top 10 aircraft in the deployment period by total CNE
Aircraft Category: J = Jets, T = Turboprop. Operation Type: D = Departure, A = Arrival
5 Correlated noise events contaminated by community noise have not been uncorrelated, so it remains possible that
the maximum dB value should be lower, as the Maximum Lmax value in the table may be caused by community noise
rather than the aircraft. Examples shown in Figure 5.
Page 11
Page 11 of 19
OFFICIAL
link to page 12

FOI 24-91
OFFICIAL
Short Term Noise Monitoring – Primrose Sands, December 2024
3.5.
Noise Event Analysis
The audio verification process involved listening to and confirming the accuracy of the top 20
loudest (LaMax) noise events.
Table 7 outlines the top 10 noise events from all sources. The maximum noise levels (LaMax)
of the noise events for this deployment originated from community sources such as people, rain,
birds, sirens and vehicle noise.
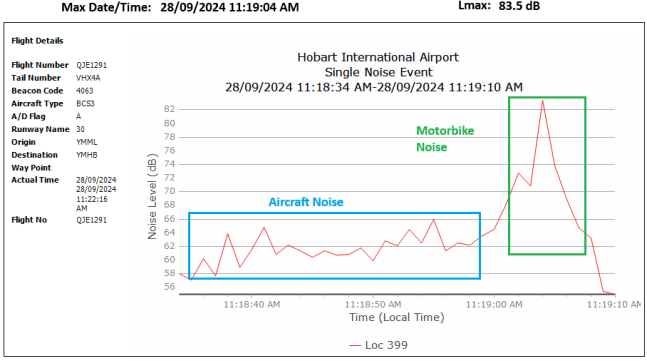
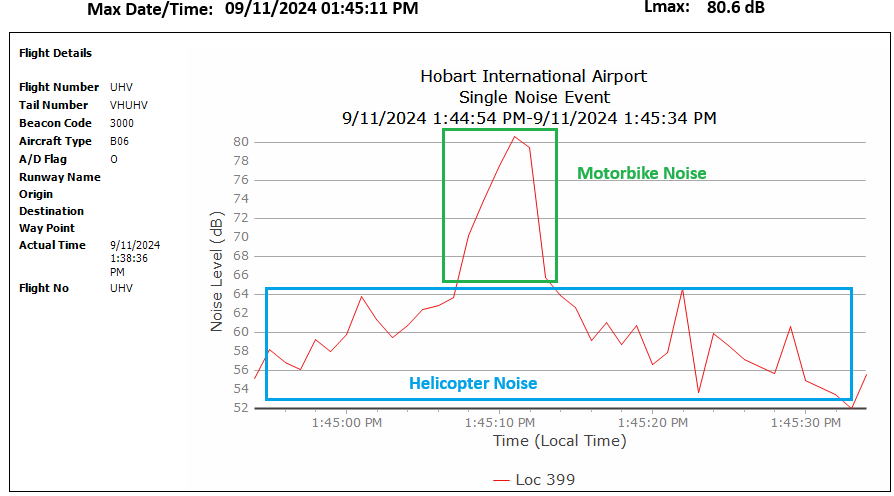
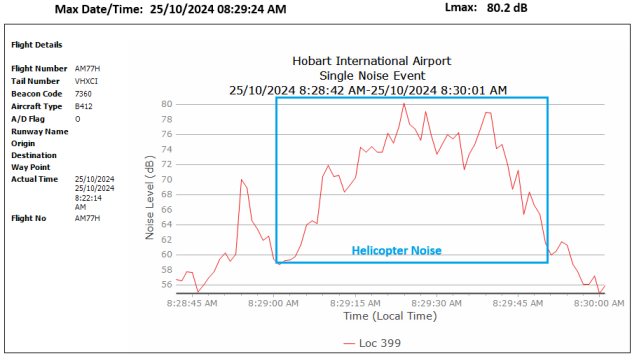
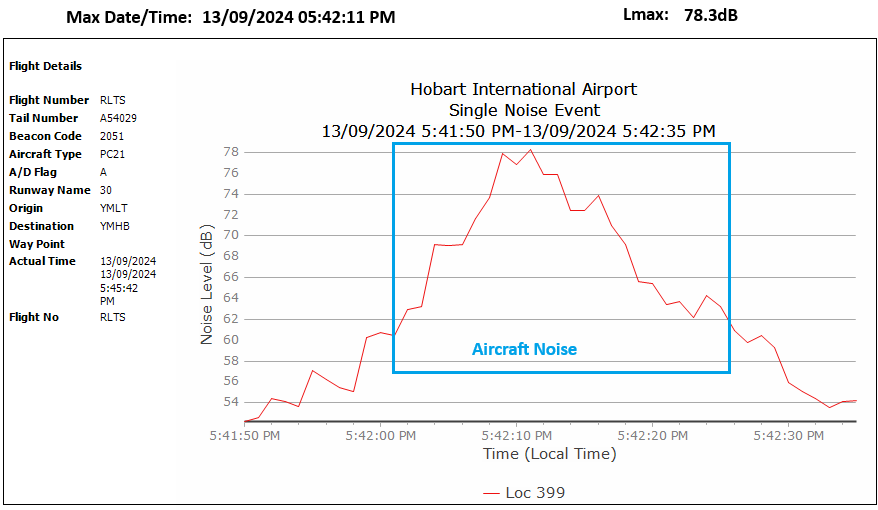
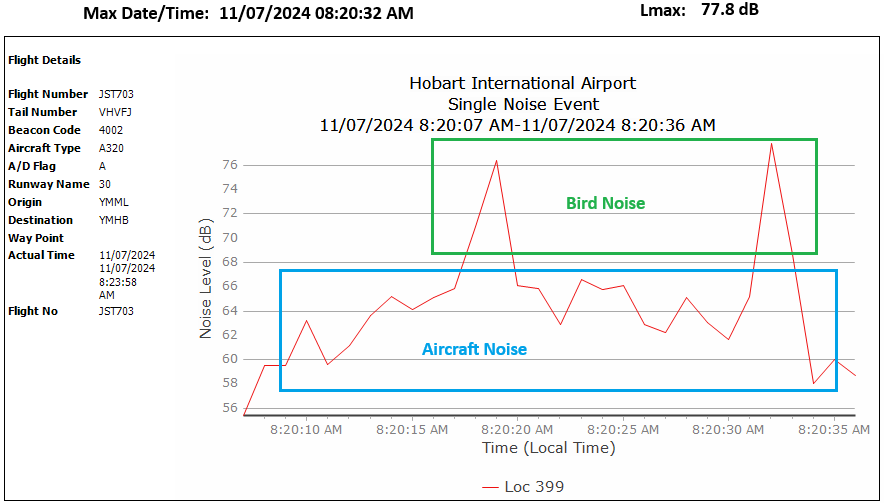
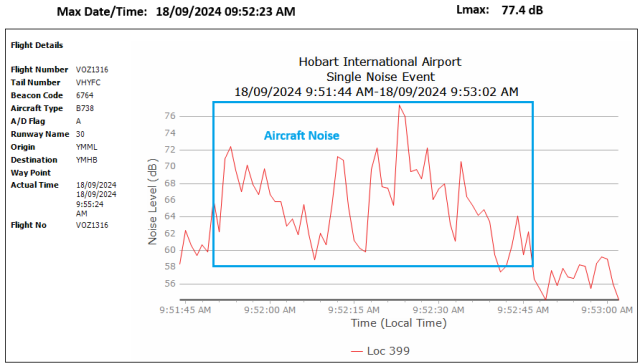
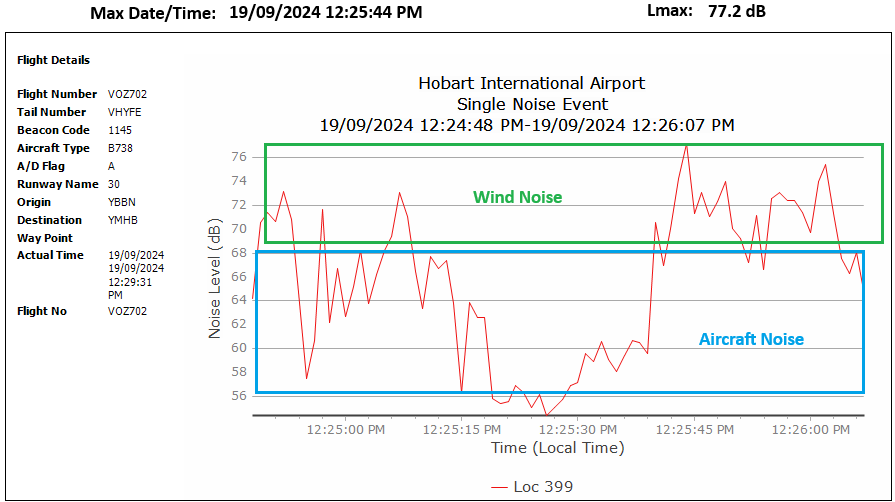
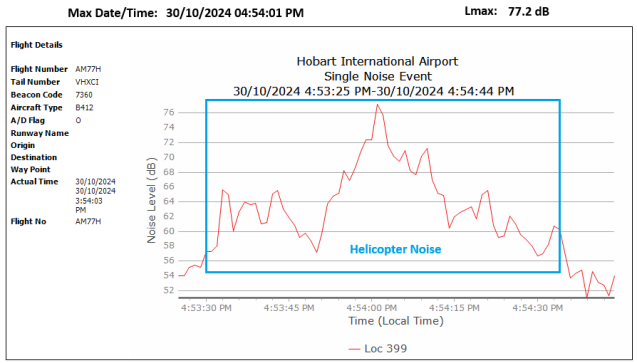
Table 8 outlines the top 10 correlated noise events (that is, correlated with aircraft noise). The
maximum noise levels (LaMax) of correlated noise events for this deployment originated from
other nearby local airport movements (Overflights) as well as Hobart Airport movements.
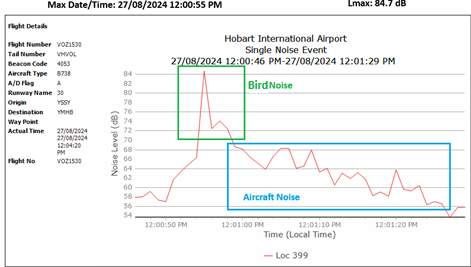
Some correlated noise events were associated with community sources in addition to aircraft.
This can be seen in the ‘noise source’ details in Table 8 and Figure 5. Consequently, there may
be a benefit in conducting further noise monitoring in this location to explore and confirm the
spectrum of noise levels attributed to aircraft, with the exclusion of any impact from community
noise contamination.
Future aircraft noise monitoring in the Primrose Sands area can achieve greater precision by:
• Choosing a location further away from the main road to minimise contamination of the
aircraft noise events from the community.
Correlated
LaMax
Aircraft Operation
Start Date/Time
to
Noise Source
Runway
dB(A)
Type6
Type
Aircraft?
22/08/2024 14:22
No
116.5
People talking
-
-
-
22/08/2024 14:22
No
110.8
People talking
-
-
-
01/09/2024 12:52
No
102.8
Birds
-
-
-
27/11/2024 10:19
No
99.0
Sirens
-
-
-
17/07/2024 15:54
No
98.5
Birds
-
-
-
21/09/2024 16:04
No
93.4
Motorbike
-
-
-
27/11/2024 10:26
No
93.4
Sirens
-
-
-
21/09/2024 10:16
No
91.5
Motorbike
-
-
-
14/09/2024 13:08
No
90.8
Rain
-
-
-
04/08/2024 9:13
No
90.7
Motorbike
-
-
-
Table 7: Top 10 loudest noise events during the deployment period by LaMax
6 Dash (-) indicates the details are not publicly available.
Page 12
Page 12 of 19
OFFICIAL
link to page 13 link to page 13 link to page 13

FOI 24-91
OFFICIAL
Short Term Noise Monitoring – Primrose Sands, December 2024
Movement
LaMax
Aircraft
Operation
Start Date/Time
Airport7
Noise Source
Runway
dB(A)
Type8
Type9
27/08/2024 12:00
Hobart
84.7
Aircraft and birds
B738
A
30
28/09/2024 11:18
Hobart
83.5
Aircraft and
BCS3
A
30
motorbike
09/11/2024 13:44
Overflight
80.6
Aircraft (Heli) and
B06
O
-
motorbike
25/10/2024 08:28
Overflight
80.2
Aircraft (Heli)
B412
O
-
13/09/2024 17:41
Hobart
78.3
Aircraft
PC21
A
30
11/07/2024 08:20
Hobart
77.8
Aircraft and birds
A320
A
30
18/09/2024 09:51
Hobart
77.4
Aircraft
B738
A
30
30/10/2024 16:53
Overflight
77.2
Aircraft (Heli)
B412
O
-
19/09/2024 12:24
Hobart
77.2
Aircraft and wind
B738
A
30
21/08/2024 11:44
Hobart
76.7
Aircraft and birds
B738
A
30
Table 8: Top 10 loudest aircraft correlated noise events during the deployment period by
LaMax
7 Overflights refers to movements from Hobart Cambridge and Edinburgh Airports etc.
8 Dash (-) indicates the details are not publicly available
9 Operation types A = Arrival, D = Departure, O = Overflight, T = Touch and Go
Page 13
Page 13 of 19
OFFICIAL

FOI 24-91
OFFICIAL
Short Term Noise Monitoring – Primrose Sands, December 2024
Figure 5: Top 9 correlated noise event from Table 8 graphed and analysed.
Page 14
Page 14 of 19
OFFICIAL

FOI 24-91
OFFICIAL
Short Term Noise Monitoring – Primrose Sands, December 2024
4 Busiest Day Analysis
4.1.
Discussion
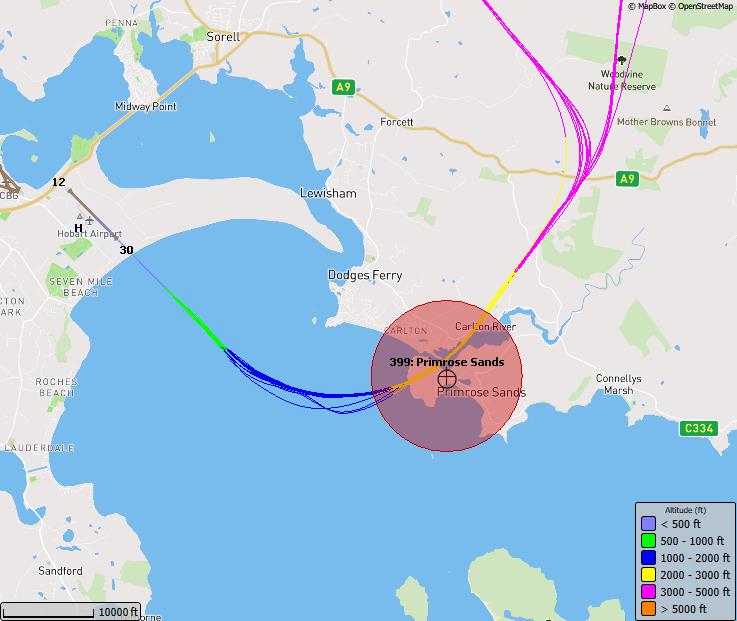
The busiest day during the deployment period occurred on 11 June 2024, with a total of 486
noise events. The noise events consisted of jet, turboprop, bird and wind noise. There were 17
aircraft captured passing through the zone from Hobart Airport movements, of which 16 aircraft
were from the focus group. The predominant movement over the capture zone was from jet
operations (94%).
Figure 6: Busiest day flight tracks
Page 15
Page 15 of 19
OFFICIAL

FOI 24-91
OFFICIAL
Short Term Noise Monitoring – Primrose Sands, December 2024
4.2.
Busiest Day Graph
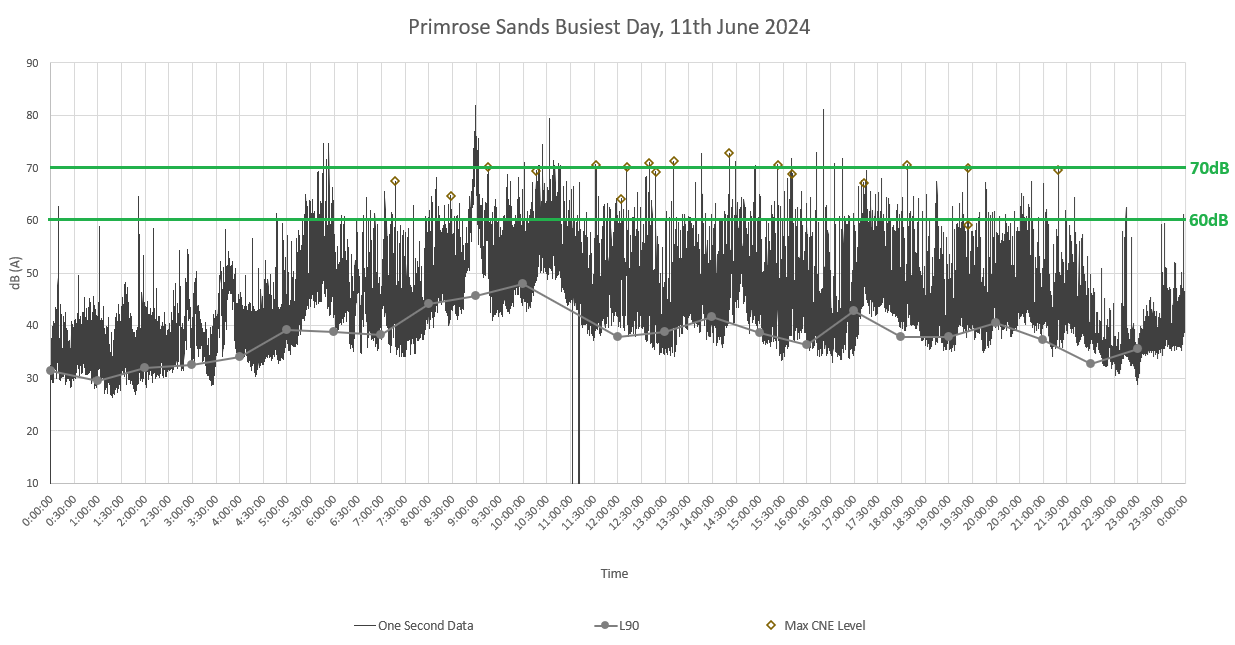
Figure 7: Distributions of hourly L90, max CNE level and one-second noise data on the busiest day. Hourly L90 refers to background noise levels; see
Section 6.1.1 for more information. Max CNE level refers to the maximum noise level of the noise event, known as LaMax, which occurs when the aircraft
is within the capture zone of the noise monitor; see Section 6.1.2 for more information. One-second noise data refers to the sound levels that are
recorded every second by the noise monitor.
Page 16
Page 16 of 19
OFFICIAL

FOI 24-91
OFFICIAL
Short Term Noise Monitoring – Primrose Sands, December 2024
4.3.
Busiest Day Noise Levels
The loudest event on the 11 June 2024, reaching a maximum noise level of 72.9(A) at 08:59:33
in the morning, lasting for 80 seconds. This audio event is not present in order to determine the
type of community noise.
5 Further Information
The following platforms provide further information on Hobart aircraft noise monitoring.
5.1.
Airservices Australia
Information on the noise and flight path monitoring system including approach to noise
monitoring and frequently asked questions:
https://www.airservicesaustralia.com/community/environment/aircraft-noise/monitoring-aircraft-
noise/
5.2.
WebTrak
Aircraft noise data is displayed from live noise monitors across Hobart, along with historical data:
https://webtrak.emsbk.com/hba3
Page 17
Page 17 of 19
OFFICIAL

FOI 24-91
OFFICIAL
Short Term Noise Monitoring – Primrose Sands, December 2024
6 Appendix
6.1.
Noise Event Detection Details:
ISO 20906 provided technical guidance in this short-term noise monitoring. The NMT (i.e.,
sound level monitor) used for testing passed the Class 1 periodic calibration tests outlined in
clauses of IEC 61672-3:2013 and IEC 61260-3:2016. The placement of NMT considered the
vicinity of reflective surfaces and the height of the NMT relative to the target aircraft operations
to minimise potential unintended anomalies. The NMT height is fixed on a supporting pole and
the captured noise events were observed acceptable throughout the deployment. The
background noise levels were taken into account in the monitoring area, to appropriately capture
aircraft noise levels.
6 . 1 .1 . T h r e s h o l d S e tt i n g s
Noise monitor threshold settings are established by collecting hourly average L90 data over a
period of two to five days following installation of the noise monitor. L90 represents noise level
which are exceeded 90% of the time. It is considered the background noise level of an
environment. For instance, if the L90 hourly noise level reads 50dB(A), it means that for 90% of
that hour, the noise level is above 50dB(A). The threshold is set close to the average
L90+10dB(A). The addition of 10dB(A) effectively filters out most community noise, such as
birds and animal sounds, machinery, and vehicle noises. As a result, the created noise event
will predominantly contain aircraft noise with minimal community noise.
6 . 1 .2 . A i r c r a f t a n d N o i s e E v e n t Co r r e l a t i o n
The correlation of a noise event with an aircraft requires meeting the following conditions:
• The aircraft passes through the defined capture zone set by the monitor as shown in
Figure 1.
• The rise and fall time of the measured event matches a sound pattern representative of
an aircraft flyover.
• Noise levels are greater than the specified threshold for a specified period when aircraft
flies over, this creates a noise event.
• Maximum noise level of the noise event known as LaMax must occur while the aircraft
is within the capture zone of the noise monitor.
Aircraft that flew within the vicinity of the monitor but did not trigger a correlated noise event may
have failed to meet some of the parameters above. In other instances, this could be attributed
to the lack of air traffic control data (ATC). This occurs when aircraft do not have an operating
transponder or when there are radar outages. Despite a noise event being created by the
aircraft, without available ATC data, there will be no aircraft to correlate with the noise event.
Page 18
Page 18 of 19
OFFICIAL

FOI 24-91
OFFICIAL
Short Term Noise Monitoring – Primrose Sands, December 2024
6.2.
Calibration Check
The integrity of the noise monitor relies on regularly verifying the accuracy of the microphone
recording levels and time synchronisation of samples with radar data. The microphones are
replaced with laboratory certified microphones every 12 months and electrostatic calibration
tests are automatically performed daily to ensure data quality.
Page 19
Page 19 of 19
OFFICIAL


